Do you have the right analytics framework for your product?

A Lean Startup is a company that has the specific goal of changing the world by creating an amazing product. An important element of the growth engine of a startup is what metrics to measure and how fast is growing. Startups must focus on right metrics so that they don’t misuse resources and time on the wrong objectives, instead, they must focus on the metrics that will let get best results. During the years, a series of analytics frameworks were adopted, and they differ by a set of metrics and area on which to focus.
Dave McClure’s Pirate Metrics
Dave McClure coined the term Pirate Metrics from the acronyms for the five elements needed for a successful Startup.
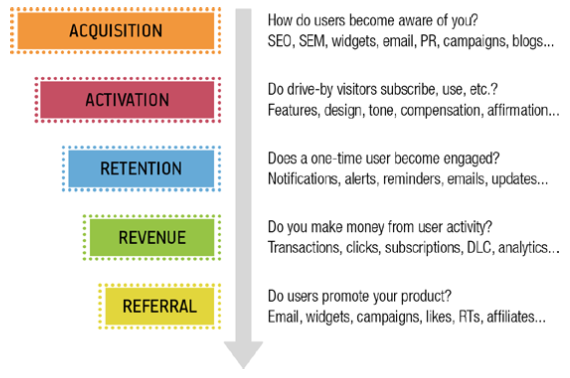
For McClure, the focus of a startup should be on the acquisition, activation, retention, revenue, and referral (Fig.1). In presence of a structure that constantly measure all those five analytics and adapt accordingly, the success of the startup is more likely to happen. Each element of the list has a function and relevant metrics. The acquisition is all about generating attention from the users through different strategies and the metrics that are relevant for it are traffic, cost per click, search for the result and open rate. Activation is about changing the attracted users in enrolled users, and of course, the metrics that we want to check are enrolled user count, signups, and subscriptions. Retention is about increasing the stickiness of our enrolled users, metrics like time since the last visit, engagement, daily and monthly active use is will be important for this matter. Revenue is our business model, how we are performing based on our business model. Revenue important metrics are customer lifetime value, conversion rate, shopping cart size, click-through revenue. Lastly, a referral is about spreading words about our product or service, and metrics about it are invites sent, viral coefficient, and viral cycle time.
Eric Ries’s Engine Growth
Eric Ries analytics framework focuses on three engines that drive the growth of a startup. He refers to key performance indicators (KPIs) when he points out the important metrics of each engine of growth. The first Ries’s Engine of Growth is the sticky engine. Like McClure’s pirate metrics retention, Ries put his focus on the ability to retain users and to keep them active. Engagement is one of the best predictors of success. The two important KPIs here is customer retention and frequency, methods like email notifications and updates keep users coming back and be engaged. The second engine is the virality engine. Virality is all about spreading the word about the product or service. It is an attractive engine because it has a compound effect, of course within certain limits. Key metrics of this engine are viral coefficient, number of users brought in by other users and viral cycle time. Growth from the virality engine comes when the viral coefficient is greater than one, a bigger coefficient means faster growth. Paid engine is the third engine and is all about payment. Revenue is an important tool to grow but it’s not sufficient if a startup doesn’t have retention and virality. The money earned is valuable if is invested in acquiring new users. Key indicators of the paid engine are customer lifetime value (CLV) and customer acquisition cost (CAC), but the indicator of a sustainable startup is also how long It takes for a customer to repay the cost of acquisition (time to customer breakeven).
Ash Maurya’s Lean Canvas
A lean canvas is a tool for deciding which of your problems you should focus when trying to reach goals. In Ash’s canvas has a similar system based on boxes where each box has a focus on an aspect of the problem that the startup is trying to solve, each with its own metrics. The metrics will force you either to confirm what you were trying to prove, or it will bring you back to think again about your hypothesis.
|
Lean Canvas Box |
Relevant Metrics |
|
Problem |
Respondents who have this need, respondents who are aware of having the need |
| Solution | Respondents who try the MVP, engagement, churn, most-used/least-used features, people willing to pay |
| Unique value proposition | Feedback scores, independent ratings, sentiment analysis, customer-worded descriptions, surveys, search, and competitive analysis |
| Customer segments | How easy it is to find groups of prospects, unique keyword segments, targeted funnel traffic from a source |
| Channels | Leads and customers per channel, viral coefficient and cycle, net promoter score, open rate, affiliate margins, click-through rate, PageRank, message reach |
| Unfair advantage | Respondents’ understanding of the UVP (Unique Value Proposition), patents, brand equity, barriers to entry, number of new entrants, exclusivity of relationships |
| Revenue streams | Lifetime customer value, average revenue per user, conversion rate, shopping cart size, click-through rate |
| Cost structure | Fixed costs, cost of customer acquisition, cost of servicing the nth customer, support costs, keyword costs |
Sean Ellis’s Startup Growth Pyramid
Sean Ellis is an entrepreneur and marketer. He coined the term growth hacker and he came up with a pyramid of phases that let understand when a startup is ready to scale up.
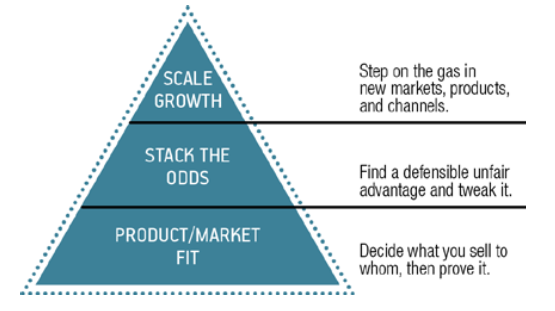
His pyramid (Fig.2) focuses on what to do after your product is fit for the market and when the startup is ready to accelerate growth. Sean is fond of surveys to your customers to understand if your startup is ready for the next phase. Users are asked what will feel if they would lose the ability to use the product and If 40% or more of the users will be disappointed, he advises that it’s time to scale.
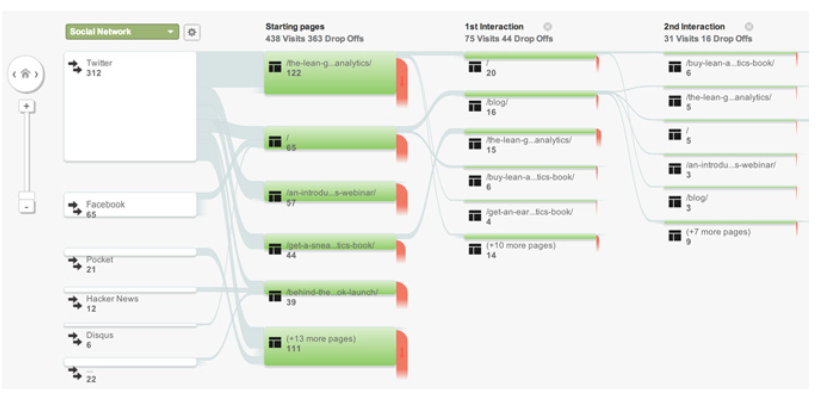
The Long Funnel
Users before buying a product they must go through a long series of actions and processes that influence their buy. Nowadays sites have complex funnels that start even offline and before reaching the site itself, tracking users before, during the visit is part of what the Long Funnel does (Fig.3). Today’s funnel extends well beyond the front door of a website, across myriad social networks, sharing platforms, affiliates, and price- comparison sites. This happens because customers may make more tentative before becoming a conversion. The Long Funnel is a way to understand when the users had his first contact with our product until they reach our goal (a purchase, acquiring user-generated content, or sharing a message).
The Lean Analytics Stages and Gates
Each framework, listed before, sees the startup facing some stages and passing through metric gates to access the next phase. Specific metrics will let the startup know if it’s ready to step into the next phase.
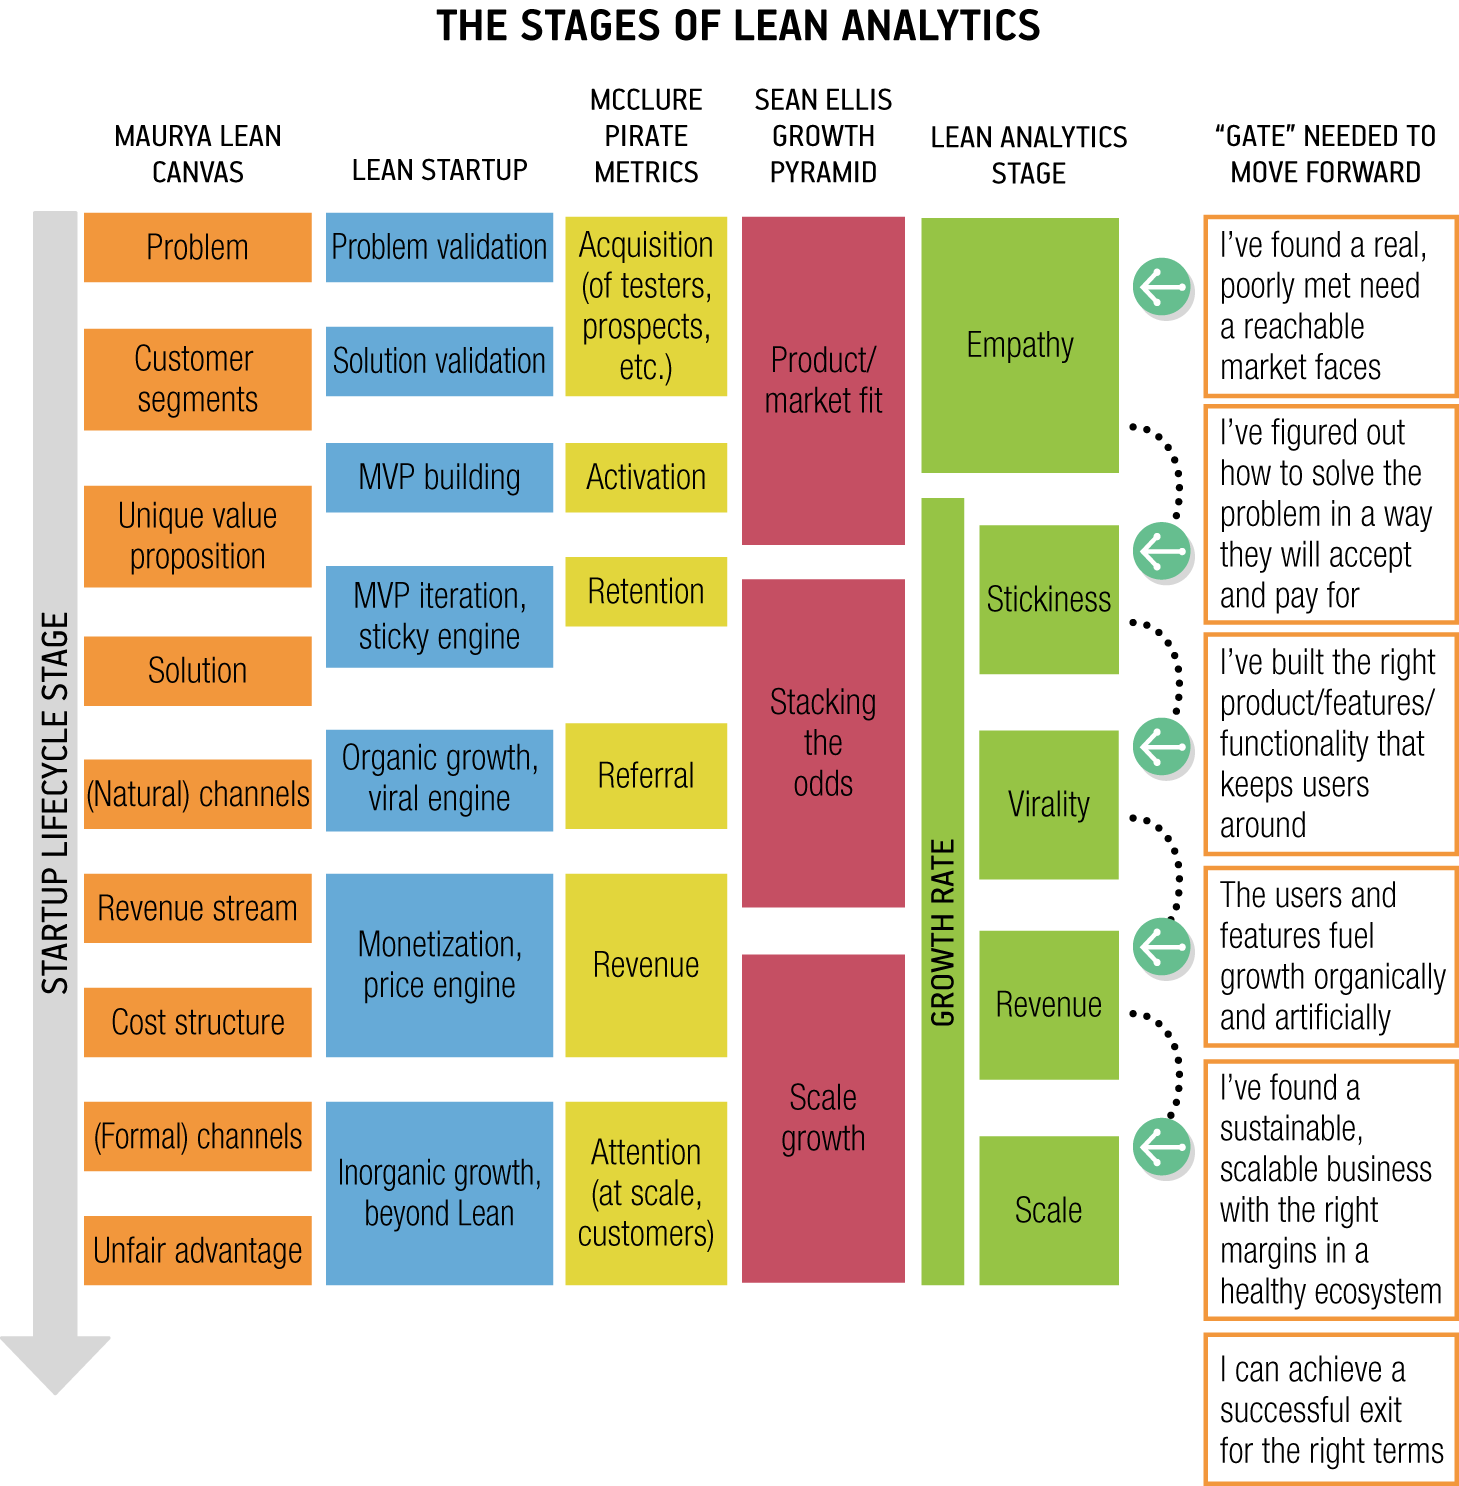
The five stages of a growing startup are Empathy, Stickiness, Virality, Revenue, and Scale. Those gates are shared between the frameworks we have analysed until now but they differ in few cases:
- Pirates Metrics and Long Funnel put their emphasis on acquiring and converting customers.
- Engine Growth and Startup Growth Pyramid grants strategies on how and when to grow.
- Lean Canvas gives an overview of your business model so that we can work on each specific element independently.
Lean Analytics Stages is a framework that distilled the best parts of those frameworks and put emphasis on metrics. It identifies five distinct stages startups go through as they grow (Fig.4).
Real World Example and Conclusions
New business models are emerging with the rise of the iPhone and Android smartphones. The two ecosystems are giving opportunities to developers to create their own app and sell services within their apps. This is highly regulated by the internal restrictions set by the two ecosystems’ owners, developers have both opportunities and challenges to face when they want to publish an app. For a Lean Startup, an app is a challenge since is not easily testable as a website where you can easily execute A/B test (A/B tests consist of a test of two versions of the same page where you compare the same metrics after a certain span of time). Some developers have come up with a solution to this problem by selling the app to smaller markets first, fix bugs and experiment until the app quality is good enough to move to a bigger market and sell it to another App Store. Mobile App developers make money within the app in several ways: they provide downloadable content, in-game advantages, saving time, elimination of countdowns, upselling paid version of the app, and in-game ads. For a Mobile App we want to track specific metrics like the number of downloads, customer acquisition cost (CAC), launch rate, percent of active users/players, percent of users who pay, time to first purchase, monthly average revenue per user, virality, churn, customer lifetime value. Installation volume is directly connected with revenue so being ranked highly in App Store is a great deal of making more money and keep a stable growth. Average revenue per user is another important metric that an app developer must keep in check, but revenue is not the only thing to care since there should be a balance between compelling content and addicting gameplay while getting the user coming back and inviting their friends for more acquisitions that refresh the whole process. A Mobile App ability to survive is based on download volumes, increase the engagement rate, minimize churn, and improve virality so customer acquisition costs go down. Balancing all those aspects is challenging for the app developer since there is a natural tension, like in the case deciding between making the gameplay more enjoyable so that churn is low and extracting more money. Another important aspect is the percentage of users that engage and pay and knowing which users are going to play for free and which are going to pay to gain an upper hand is a strategical aspect of a Mobile App. It is imperative for the developer to track those users that engage and pay for services and vanities so that we increase the knowledge base on why and when they buy, churn, and revenue compared to the non-paying ones. Churn, lastly, is something that we need to track all through the customer lifetime because users leave at the different time and for different motivations. Knowing the moment when the user is leaving gives the developer a glimpse of the user’s motivation and so how they can keep them engaged for longer. German game developer Wooga plant their decision-making activity on data and metrics. Wooga focuses on one metric and iterates quickly with successive updates, the experiment will produce new data that will let the process to an adaptation phase where another updated will be produced to test a new way to improve the targeted metric.
In conclusion, the analysed framework gives an important tool to guide startups through different stages by tracking growth metrics and in the case of a mobile app like a game the challenges we have seen are different, but they can be tracked and improved through cycles of updates. Game developers must find ways to carefully integrate monetization, particularly when it doesn’t fit the theme of the game, and must measure the impact of these revenue sources on their players’ subsequent behaviour. Mobile apps make money in different ways but from few elements of their users’ pool, the developer must track especially those few users to have specific insights from key metrics to maximise revenue while minimizing churn.
References
- Alistair Croll, Benjamin Yoskovitz. (2016). Analytics frameworks for the startup lifecycle [Blog]. Available at: https://www.oreilly.com/learning/analytics-frameworks-for-the-startup-lifecycle
- Croll, A., & Yoskovitz, B. (2013). Lean Analytics: Use Data to Build a Better Startup Faster, 409.
Video
Author: Marco Signorello
